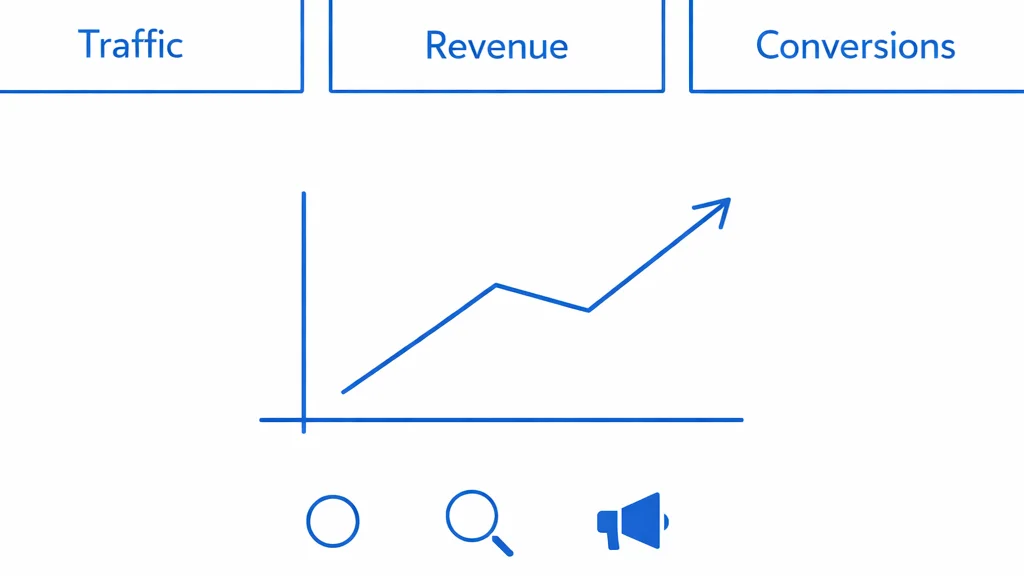
Marketing Metrics That Actually Drive Growth: The Complete 2026 Guide
Impressions and clicks don't pay the bills. Here are the 15 metrics that actually predict revenue growth—and how to track them without drowning in data.
Most marketing dashboards are full of numbers that look impressive but tell you nothing about whether your marketing actually works.
10 million impressions! 250,000 website visitors! 5,000 email subscribers! Great. Did revenue go up?
The uncomfortable truth: most marketers track metrics that make them feel busy, not metrics that prove they’re driving growth.
This isn’t because marketers are lazy or incompetent. It’s because the industry has spent decades celebrating vanity metrics—numbers that are easy to increase but don’t correlate with business outcomes. Clicks, impressions, followers, engagement rates—all useful for tactical optimization, but none of them pay the bills.
In 2026, the companies winning at marketing have made a fundamental shift: they optimize for revenue metrics, not activity metrics. They know exactly which channels drive profitable growth, how long it takes to recoup acquisition costs, and which campaigns are worth scaling vs killing.
Key Takeaways
- Most marketing metrics are vanity metrics—they look good but don’t predict revenue
- The 5 North Star metrics every company needs: CAC, LTV, payback period, marketing-attributed revenue, and blended ROAS
- Attribution is hard but non-negotiable—you can’t optimize what you can’t measure
- Different business models require different metric frameworks (B2B SaaS vs e-commerce vs transactional)
- Start simple with the metrics that matter most, then add complexity as you scale
- Speed of reporting matters—monthly dashboards are too slow for performance marketing
The Vanity Metrics Problem
Before we talk about what to measure, let’s be honest about what not to measure—or at least, what not to optimize for.
Vanity Metrics That Mislead
Website traffic. More visitors sounds good. But if they’re bouncing at 90%, coming from irrelevant sources, or never converting, traffic growth is just burning server costs.
Social media followers. A million followers who never buy is worth less than 1,000 engaged customers who refer others. Brands have gone bankrupt with huge social followings.
Email list size. 100,000 unengaged subscribers who never open emails is worse than 5,000 highly engaged readers. Deliverability tanks, costs rise, and ROI plummets.
Impressions. Your ad was shown 10 million times. To whom? Did anyone care? Impressions without attention are worthless.
Click-through rate (CTR) in isolation. A 10% CTR on traffic that never converts is worse than a 2% CTR on traffic that buys. CTR optimization without conversion tracking is a trap.
Why these metrics mislead: They can be increased without improving business outcomes. You can buy cheap traffic, fake followers, and email lists. You can optimize CTR by using clickbait. None of it drives revenue.
When they’re useful: As diagnostic tools for specific campaigns. Low CTR on a high-performing campaign? Test new creative. High traffic but low conversions? Improve the landing page. But these are tactics, not strategy.
The North Star Metrics Framework
Every company needs a small set of North Star metrics—the 3-5 numbers that, if improved, directly drive revenue growth. Everything else is either a supporting metric or noise.
Here are the 5 metrics that matter most:
1. Customer Acquisition Cost (CAC)
What it measures: How much you spend to acquire one new customer.
Formula: Total Marketing + Sales Spend / Number of New Customers
Why it matters: If it costs you $500 to acquire a customer who pays you $50, you’re going out of business. CAC is the foundational metric for growth sustainability.
How to track it:
- Calculate blended CAC (all marketing/sales spend) for the big picture
- Calculate by-channel CAC (Meta, Google, LinkedIn, etc.) to understand where to invest
- Track payback-period CAC (how long until a customer pays back their acquisition cost)
Target benchmarks:
| Business Model | Good CAC | Warning Signs |
|---|---|---|
| SaaS (B2B) | < 1/3 of first-year contract value | CAC > LTV |
| E-commerce | < 30% of first purchase value | CAC > 50% of AOV |
| Subscription | < 12 months of subscription revenue | Payback > 18 months |
| Transactional | < 20% of average transaction | CAC increasing while AOV flat |
Common mistakes:
- Not including salaries, software, and overhead in CAC calculations (just counting ad spend)
- Not tracking CAC by channel (blended CAC hides which channels are profitable)
- Ignoring CAC trends over time (rising CAC is an early warning sign)
2. Customer Lifetime Value (LTV)
What it measures: The total revenue you’ll earn from a customer over their entire relationship with your company.
Formula (simplified): Average Purchase Value × Purchase Frequency × Average Customer Lifespan
Why it matters: You can’t know if your acquisition spend is sustainable without knowing how much a customer is worth. LTV is the other side of the CAC equation.
How to calculate it properly:
For subscription businesses:
LTV = (Average [Monthly Recurring Revenue](/glossary/mrr) per Customer) × (Average Customer Lifespan in Months) × (Gross Margin %)For e-commerce:
LTV = (Average Order Value) × (Annual Purchase Frequency) × (Average Customer Lifespan in Years) × (Gross Margin %)Why gross margin matters: A customer who generates $10,000 in revenue but costs $9,000 to fulfill has an LTV of $1,000, not $10,000. Always calculate LTV based on profit, not revenue.
Target benchmarks:
- LTV:CAC ratio of at least 3:1 (you earn $3 for every $1 spent acquiring a customer)
- For SaaS companies: 5:1 or higher is ideal
- For e-commerce with repeat purchases: 4:1 or higher
Common mistakes:
- Using revenue instead of profit margin in LTV calculations
- Not accounting for churn (especially critical for SaaS)
- Assuming every customer has the same LTV (segment by acquisition channel, product, or cohort)
3. Payback Period
What it measures: How long it takes for a customer to generate enough profit to recoup their acquisition cost.
Formula: CAC / (Average Monthly Revenue per Customer × Gross Margin %)
Why it matters: Even if your LTV:CAC ratio is great, if it takes 3 years to break even on a customer, you’ll run out of cash before you scale. Payback period determines how fast you can grow without raising capital.
Target benchmarks:
| Business Type | Ideal Payback Period | Maximum Acceptable |
|---|---|---|
| SaaS (B2B) | < 12 months | 18 months |
| SaaS (B2C) | < 6 months | 12 months |
| E-commerce (one-time) | Immediate | 3 months |
| E-commerce (subscription box) | < 3 months | 6 months |
Why it matters for growth: The faster your payback period, the faster you can reinvest profits into more customer acquisition. A 6-month payback period means you can double your marketing spend every 6 months without external funding. An 18-month payback period means growth requires constant capital injections.
Common mistakes:
- Forgetting to account for gross margin (using revenue instead of profit)
- Not tracking payback period by channel (some channels pay back faster than others)
- Ignoring cohort effects (customers acquired in Q1 may have different payback than Q4 customers)
4. Marketing-Attributed Revenue
What it measures: How much revenue can be directly traced to marketing efforts.
Why it matters: This is the metric that answers the CEO’s question: “What are we getting for our marketing spend?”
How to track it:
You need attribution—connecting revenue back to the marketing touchpoints that influenced it. There are several models:
| Attribution Model | What It Measures | Best For |
|---|---|---|
| Last-click | Credit to the final touchpoint before conversion | Simple tracking, high-intent channels like Google Search |
| First-click | Credit to the first touchpoint | Understanding awareness drivers |
| Linear | Equal credit to all touchpoints | Understanding full journey |
| Time-decay | More credit to recent touchpoints | Balancing awareness and conversion |
| Data-driven (GA4) | Algorithmic credit based on statistical contribution | Best for companies with significant traffic volume |
The truth about attribution: No model is perfect. Every model is wrong, but some are useful. Start with data-driven attribution in GA4 for most companies. Graduate to incrementality testing (geographic holdouts, conversion lift studies) as spend increases.
How to set it up:
- UTM parameters on every link. Non-negotiable. Format:
utm_source=facebook&utm_medium=cpa&utm_campaign=q1-launch - CRM integration. Connect ad platforms (Meta, Google, LinkedIn) to your CRM (HubSpot, Salesforce, Pipedrive). Track leads → opportunities → closed revenue.
- Google Analytics 4. Configure with e-commerce tracking or lead conversion events. Set up custom funnels.
- Unified dashboard. Pull all data into one place: Looker, Tableau, or a custom analytics dashboard.
Target benchmark: At least 60-70% of revenue should be attributable to known marketing sources. If less than 50% is attributable, your tracking is broken.
5. Return on Ad Spend (ROAS)
What it measures: Revenue generated for every dollar spent on advertising.
Formula: Revenue from Ads / Ad Spend
Why it matters: This is the efficiency metric for paid media. A 3x ROAS means every $1 spent on ads generates $3 in revenue.
Target benchmarks:
| Business Model | Minimum ROAS | Good ROAS | Great ROAS |
|---|---|---|---|
| E-commerce | 2.5x | 4x | 6x+ |
| SaaS (B2B) | 3x | 5x | 8x+ |
| Lead gen | 3x | 6x | 10x+ |
| Retail | 3x | 5x | 8x+ |
Blended ROAS vs channel ROAS: Always track both. Blended ROAS includes all ad spend across all channels. Channel ROAS isolates individual platforms.
Important caveat: ROAS measures revenue, not profit. A 4x ROAS sounds great, but if your gross margin is 20%, you’re barely breaking even. Always calculate profit ROAS (profit from ads / ad spend) for true performance.
Common mistakes:
- Comparing ROAS across channels with different roles (awareness vs conversion campaigns have different ROAS expectations)
- Optimizing for short-term ROAS at the expense of long-term brand building
- Not accounting for lifetime value (a 2x ROAS on first purchase might be fine if customers come back and buy repeatedly)
Supporting Metrics: The Second Tier
Once you’ve nailed the North Star metrics, these supporting metrics help diagnose performance and optimize tactics:
Channel Performance Metrics
By channel, track:
- Cost per click (CPC): Are you paying too much for traffic?
- Click-through rate (CTR): Is your creative resonating?
- Conversion rate: Does the traffic convert once it lands?
- Cost per acquisition (CPA): How much to acquire one customer on this channel?
How to use them: Diagnose where campaigns are breaking. High CPC + low CTR = weak creative or wrong audience. High CTR + low conversion rate = landing page problem. High conversion rate + high CPA = expensive traffic.
Funnel Metrics
Track drop-off at every stage:
- Impressions → Clicks (CTR)
- Clicks → Landing Page Visits (traffic quality)
- Landing Page Visits → Leads (conversion rate)
- Leads → Opportunities (lead quality)
- Opportunities → Customers (close rate)
Why it matters: If 10% of opportunities close but only 2% of leads become opportunities, your lead quality is the bottleneck. Fix that before optimizing top-of-funnel.
Content & SEO Metrics
For content marketing and SEO:
- Organic traffic growth (month-over-month, year-over-year)
- Keyword rankings for target terms via keyword research
- Backlinks and domain authority
- Conversion rate from organic traffic
- Revenue from organic traffic
Common mistake: Celebrating traffic growth without tracking organic revenue. Organic traffic that doesn’t convert is just expensive hosting costs.
Email Marketing Metrics
For email campaigns:
- Open rate (are subject lines working?)
- Click rate (is content engaging?)
- Conversion rate (do clicks turn into actions?)
- Revenue per email (ultimate measure of email value)
- List growth rate (healthy list growth = strong lead gen)
Benchmark: A healthy email program should drive 15-25% of total revenue for e-commerce and subscription businesses.
Brand Metrics (for larger companies)
If you’re investing in brand campaigns:
- Branded search volume (are more people searching for your brand?)
- Direct traffic (are people coming directly to your site?)
- Unaided brand awareness (surveys: “What brands come to mind when you think of [category]?”)
- Share of voice (your brand mentions vs competitors)
Why it matters: Brand campaigns don’t convert immediately. Track leading indicators of brand strength to justify the investment.
How to Build a Marketing Metrics Dashboard
You don’t need a $50K data analytics platform. You need the right metrics, updated frequently, in one place.
Step 1: Start with a Simple Spreadsheet
Before investing in dashboards, track the North Star metrics manually for 4-8 weeks:
- Weekly: Ad spend by channel, leads, customers, revenue
- Calculate: CAC, ROAS, payback period
- Identify: Which channels drive profitable growth?
This teaches you what data you actually need and where the gaps are.
Step 2: Automate Data Collection
Once you know what to track, automate it:
- Google Sheets + Supermetrics: Pull data from Meta, Google, LinkedIn, GA4 into a single spreadsheet (starts at $99/month)
- Looker Studio (free): Connect to Google Analytics, Google Ads, and other sources for real-time dashboards
- Tableau / Power BI: Enterprise-grade dashboards with advanced visualization
- Custom dashboards: For complex needs or multi-channel attribution, build a custom analytics solution
Step 3: Make It Accessible
The best dashboard is the one people actually look at.
- One dashboard per audience: Executives need North Star metrics. Channel managers need tactical diagnostics. Don’t try to build one dashboard for everyone.
- Update frequency matters: For performance marketing, daily updates. For content/SEO, weekly is fine. For brand, monthly.
- Make it visual: Numbers in tables don’t drive action. Trend lines, color-coded KPIs, and alerts do.
Metric Frameworks by Business Model
Different businesses need different metric priorities.
B2B SaaS
Primary metrics:
- Monthly Recurring Revenue (MRR) growth
- CAC by channel
- LTV:CAC ratio
- Payback period
- Pipeline velocity (how fast leads → customers)
Why: SaaS is about efficient, predictable growth. CAC and LTV determine if your business model is sustainable.
E-commerce
Primary metrics:
- Revenue and profit by channel
- ROAS by channel
- Average Order Value (AOV)
- Repeat purchase rate
- Contribution margin per order
Why: E-commerce is about volume and efficiency. ROAS and repeat purchase rates determine profitability.
Lead Generation
Primary metrics:
- Cost per lead (CPL) by channel
- Lead-to-customer conversion rate
- Customer acquisition cost (CAC)
- Revenue per lead
- Sales cycle length
Why: Lead gen is about quality and conversion. Cheap leads that don’t convert are worthless.
Marketplace / Two-Sided Platform
Primary metrics:
- Supply-side CAC (attracting sellers/providers)
- Demand-side CAC (attracting buyers/users)
- Take rate (% of transaction value)
- GMV (Gross Merchandise Value)
- Repeat transaction rate
Why: Marketplaces have dual acquisition challenges. Both sides need to grow in balance.
The Biggest Mistakes Companies Make with Metrics
Mistake #1: Tracking Too Much
The average marketing dashboard has 30+ metrics. Nobody can optimize 30 things simultaneously.
Fix: Pick 5 North Star metrics. Track everything else, but don’t optimize for it unless the North Star metrics point to a problem.
Mistake #2: Monthly Reporting for Performance Marketing
If you’re running paid media, monthly reports are too slow. By the time you see that a campaign isn’t working, you’ve already burned the budget.
Fix: Daily or weekly dashboards for paid channels. Monthly is fine for content, SEO, and brand.
Mistake #3: Celebrating Activity Instead of Outcomes
“We published 50 blog posts this quarter!” Great. Did organic traffic increase? Did organic revenue increase? Did anything that matters improve?
Fix: For every activity metric (posts published, emails sent, ads launched), track the outcome metric (organic revenue, email revenue, ad ROAS).
Mistake #4: Ignoring Attribution
“We don’t have attribution set up yet, but we’ll get to it eventually.”
No. Attribution is non-negotiable. Without it, you’re flying blind. You’ll over-invest in channels that look good on last-click but don’t actually drive growth. You’ll under-invest in awareness channels that create demand.
Fix: Set up UTM parameters, CRM integration, and GA4 tracking in your first 90 days. It’s not optional.
Mistake #5: Not Segmenting Metrics
Blended metrics hide the truth. A 4x ROAS across all channels sounds great—until you realize Meta is at 6x ROAS and Google is at 1.5x ROAS.
Fix: Segment every metric by channel, campaign, audience, and time period. The insights are in the details.
How AI Changes Marketing Measurement
AI-native agencies and tools are transforming how we measure marketing:
Real-time anomaly detection. AI monitors metrics 24/7 and alerts you when something breaks (campaign overspending, audience fatigue, sudden traffic drop).
Predictive analytics. Instead of reacting to what happened, AI predicts what will happen next (which leads are most likely to close, which campaigns will scale profitably).
Automated reporting. No more copying data into slides. AI generates insights, trend analysis, and recommendations automatically.
Cross-channel attribution. AI can model complex customer journeys across dozens of touchpoints, revealing the true impact of each channel.
The result: faster decisions, better optimization, and less time drowning in spreadsheets.
FAQ
How many metrics should I track?
Track everything. Optimize for 5. Your North Star metrics (CAC, LTV, payback period, marketing-attributed revenue, ROAS) should guide strategy. Everything else is diagnostic.
What if I don’t have enough data for meaningful metrics?
Start simple. If you’re spending $2K/month on ads and getting 10 conversions, you can still calculate CAC ($200 per customer). As volume increases, add complexity. But don’t wait for “enough data” to start tracking.
How do I set up attribution if I’m not technical?
Start with UTM parameters (easy: use a URL builder). Connect your ad accounts to your CRM (most CRMs have one-click integrations). Set up Google Analytics 4 with conversion tracking (use GA4 setup guides or hire someone for a one-time setup). If you’re working with an agency like wieldr, we handle all of this for you.
Should I focus on ROAS or CAC?
Both. ROAS tells you short-term efficiency (revenue per dollar spent). CAC + LTV tells you long-term sustainability (are customers profitable?). Optimize ROAS in the short term, but always monitor CAC:LTV to ensure you’re not sacrificing long-term profitability.
How often should I review metrics?
Daily for paid media campaigns (spot problems fast). Weekly for most marketing activities. Monthly for strategic reviews and long-term trends. Quarterly for executive reporting.
What’s the most important metric to start with?
Customer Acquisition Cost (CAC). If you don’t know how much it costs to acquire a customer, you can’t make smart decisions about marketing spend. Start there.
Need help setting up metrics that actually matter? Get in touch. We build real-time dashboards, cross-channel attribution, and the analytics infrastructure that drives growth.
Related reading: The Multi-Channel Marketing Playbook for 2026 · Why AI-Native Agencies Will Dominate Marketing in 2026 · From Startup to Scale: Marketing That Grows With You
Topics
Key Terms in This Article
CPC
Cost Per Click – the amount you pay each time someone clicks your ad.
CPA
Cost Per Acquisition – how much you pay to acquire one customer or conversion.
CPL
Cost Per Lead – the cost to generate one qualified lead.
CTR
Click-Through Rate – the percentage of people who click your ad after seeing it.
ROAS
Return On Ad Spend – revenue generated for every dollar spent on advertising.
ROI
Return On Investment – the profitability of your marketing investment.
Related Services
Related Articles
The Multi-Channel Marketing Playbook for 2026
Running campaigns across Meta, LinkedIn, Google, TikTok, and more doesn't have to be chaos. Here's a complete framework for building a coordinated, data-driven multi-channel strategy that scales.
Why AI-Native Agencies Will Dominate Marketing in 2026
Traditional agencies are built for a world that no longer exists. AI-native agencies deliver faster execution, better results, and 40-60% lower costs. Here's exactly how—and what it means for your marketing.
From Startup to Scale: The Marketing Playbook for Every Growth Stage
Your marketing strategy at seed stage won't work at Series B. Here's exactly how to evolve your approach at each funding stage—channels, budget splits, team structure, and the mistakes that kill growth.
Need help turning this into a system?
Wieldr works with selected teams on strategy, paid media, measurement, creative testing, and AI-native marketing workflows.
Work with Wieldr